One of the problems with measuring Incident Response is that many of the commonly used metrics are not actually related to the performance or efficiently of the IT/Security staff.
Issues like the number of “Ransomware attacks contained”, “web brute-force attacks controlled” or “phishing emails blocked” are not directly measurable against the IR staff; thus it is hard to gauge the impact new staff, training or tooling has on the team’s abilities.
In this series of blog posts I aim to look at some of the metrics that can be tracked, by staff so they can identify areas for improvement and how new improvements are improving their performance. I will also identify the influencers of these areas so you can understand what to focus upon.
These are based upon the evening presentation I gave at SANS Munich in March 2018, the slides from this are available here.
Breaking down the incident stages
To be able to examine and understand the improvements we can bring to the overall IR process we need to breakdown the stages of handling our incidents into smaller discrete tasks. While still aligned to the NIST Computer Security Incident Handling Guide (800-61R2) [https://nvlpubs.nist.gov/nistpubs/specialpublications/nist.sp.800-61r2.pdf] by breaking down each task in the IR process, we can examine the aspects of the business that influence the time taken for each. Thus we can look to improve the overall IR response time by removing the individual task bottlenecks and roadblocks.
In terms of the Cyber Kill Chaintm (CKC) the attack here could be a combination of the following:
3 – Delivery,
4 – Exploitation,
5 – Installation,
6 – Command and Control (potentially).
IR Timelines Stages
Below is the colourised version of the diagram I presented at the SANS@Night Munich event, and I will refer to this as we step through the IR process.
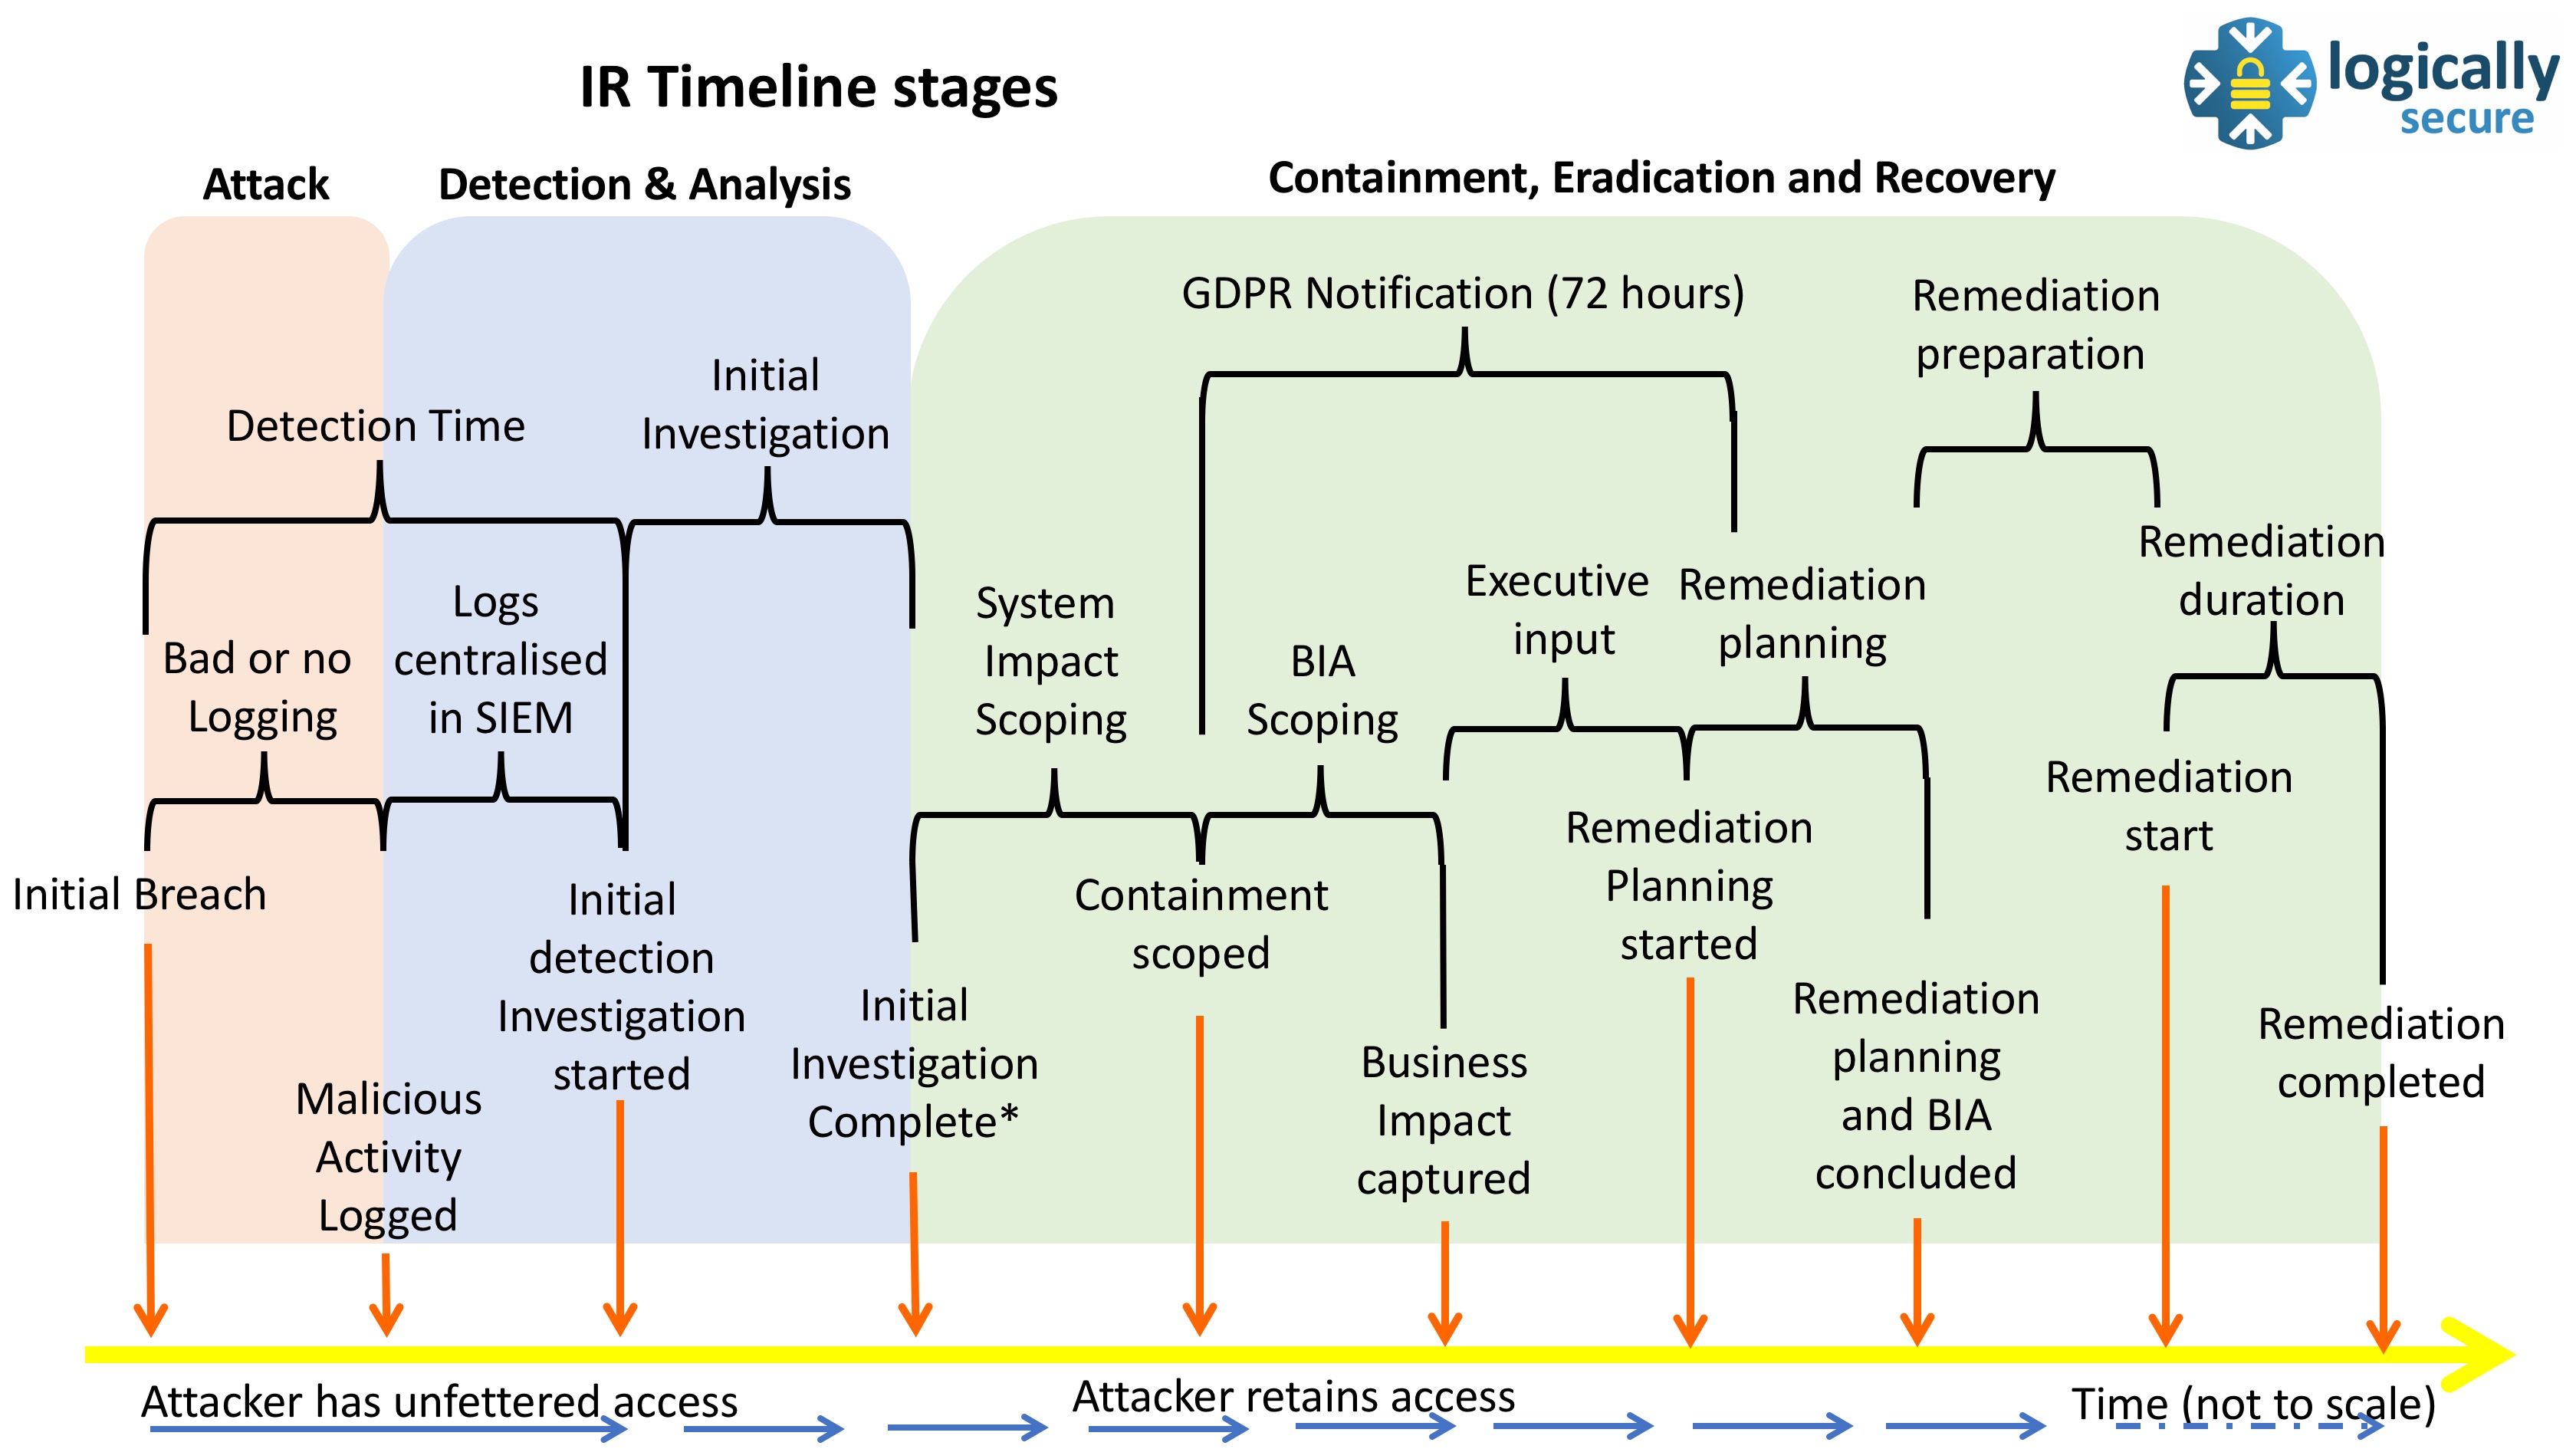
This post will look at the Attack and Detection time.
Note: In this blog series, I am working on the assumption that with GDPR being enforced from 25th May 2018, we will use the phrase “Case” before declaring an “Incident”. Furthermore, we will commence GDPR Notification once PII or user data has been identified as being affected.
Detection Time
The Detection Time is the time taken for the attackers activity to be actually detected. Simple though that may seem, it is surprising how long that can take in some organisations.
The Mandiant M-Trends reports have tracked the Average time from Compromise to Detection and while this has improved in recent years, it still shows the attackers having sufficient undetected time on the network to build out a covert infrastructure.
- 2011 – 416 days
- 2012 – 243 days
- 2013 – 229 days
- 2014 – 205 days
- 2015 – 146 days
- 2016 – 99 days (Americas)
- 2016 – 106 days (EMEA)
- 2017 – 75.5 days (Americas)
- 2017 – 175 days (EMEA) – latest figures from the 2018 Report
Below is a diagram from page 5 of the latest M-Trends report, in it the following terms are explained:
Dwell time is the number of days from first evidence of compromise that an attacker is present on a victim network before detection. A median represents a value at the midpoint of a sorted data set. Mandiant continues to use the median value over ‘mean’ or ‘average’ to minimize the impact of outlying values.

In analysing this Detection Time, we break it down in to two distinct parts; the initial part when little or no logging of value occurs and the part when some activity is logged and centralised or alerted upon .
Bad / No logging
Ideally the attack would be immediately detected by the IR team and an investigation started; however, this is not always the case and any of the following can result in no initial logging occurring:
- Hosts with poor or un-configured logging profiles – the attack does not result in logs being generated
- Large networks with no centralised logging – while logs reside on local systems they are not centralised and subjected to automated checking
- Networks supported by with relatively immature security teams with limited host-based tooling – no host-based centrally alerting IDS/IPS agents
- Advanced Attackers using zero-day attacks and excellent penetration tradecraft – thus their skill defeats logging attempts
- Distributed systems with high latency log movement – where logs are sent in batches to other servers
- High volume logs with low quality data drown out other important events in the logs – the signal to noise ratio is wrong
Examples of these problems are:
- Windows hosts that don’t have Windows Event Forwarding (WEF) enabled to push at the least Event IDs from the desktop hosts: 4624 (logon), 4625 (failed logon), 7040 (service changed from disabled to auto-start), 7045 (service installed), 4648 (logon explicit creds).
- Web proxies and WEF that are not in transparent mode so the proxy IP is recorded in all web server logs; rendering them almost useless.
- Servers with non centralised log files still with the default size of (20Mb).
“Remember that no logging means no alerting or investigating can occur”
This lack of logging, poor log visibility or badly configured host-based alerting means that no one is looking at attacked systems as they simply have not been alerted to unusual activity. This can be addressed and this whole mini-phase closed down by the following:
- Applying a validated good logging profile to all systems, especially internet connected (desktops) and facing systems (servers).
- Implementing a host-based IDS/IPS with central logging/alerting enabled.
- Centralising these logs for analysis.
Logs centralised in SIEM
Once the logs are centralised they can then be analysed and some form of correlation can be conducted. The common problem here is that either too much or too little is being logged. Too little and the chance of seeing the attacker is reduced. Too much data being logged and your ability to process, correlate and store the logs will be hampered.
Additionally, while IR staff as for *.* “all the logs” what they usually want is the right quality logs with suitable data fields included. This is a key distinction as many SIEMs charge on events per second and therefore there is a simple cost ceiling as to how many events you can add to a SIEM. Thus you may want to store and stage your logs before pushing a filtered stream into your SIEM.
A very good paper on this was written by ContextIS (commissioned by the UK NCSC) and is here.
What are you looking for?
So now we have our logs in the server or SIEM, we need to have an idea of what to look for. While most SIEMs come with some rule engines, not all come with these rules configured. Thus new installations with new staff lack an appreciation of what to look for and how. Furthermore, they lack good sourced of Indicators of Compromise (IoC) or Cyber Threat Intelligence (CTI).
Without these the team will be slow to detect attacks as low levels of automation mean that detection does not happen based upon IOCs but from analyst assessing logs. This is exceptionally expensive and it introduces varying quality as different teams work at different rates “night shift syndrome” (where the *other* shift never seems to find as much stuff as the your/day team).
So by introducing some good sources of IoC’s and CTI analysts can create watch-lists, and cross check the results rather than manually searching logs.
To summarise
- Get filtered logs to SIEMs to maximise CPU and license investments.
- Identify good Cyber Threat Intelligence and Indicators of Compromise feeds – note many of the good ones do cost.
- Automate the detection of commodity malware and attacks.
- Reduce the log analysis time through the use of IOC detection, watch-lists and other flags to staff that there is something worthy of a short initial investigation
In the next post we will look at the Initial Investigation